

 Facebook
 X
X
 Pinterest
 Copy Link
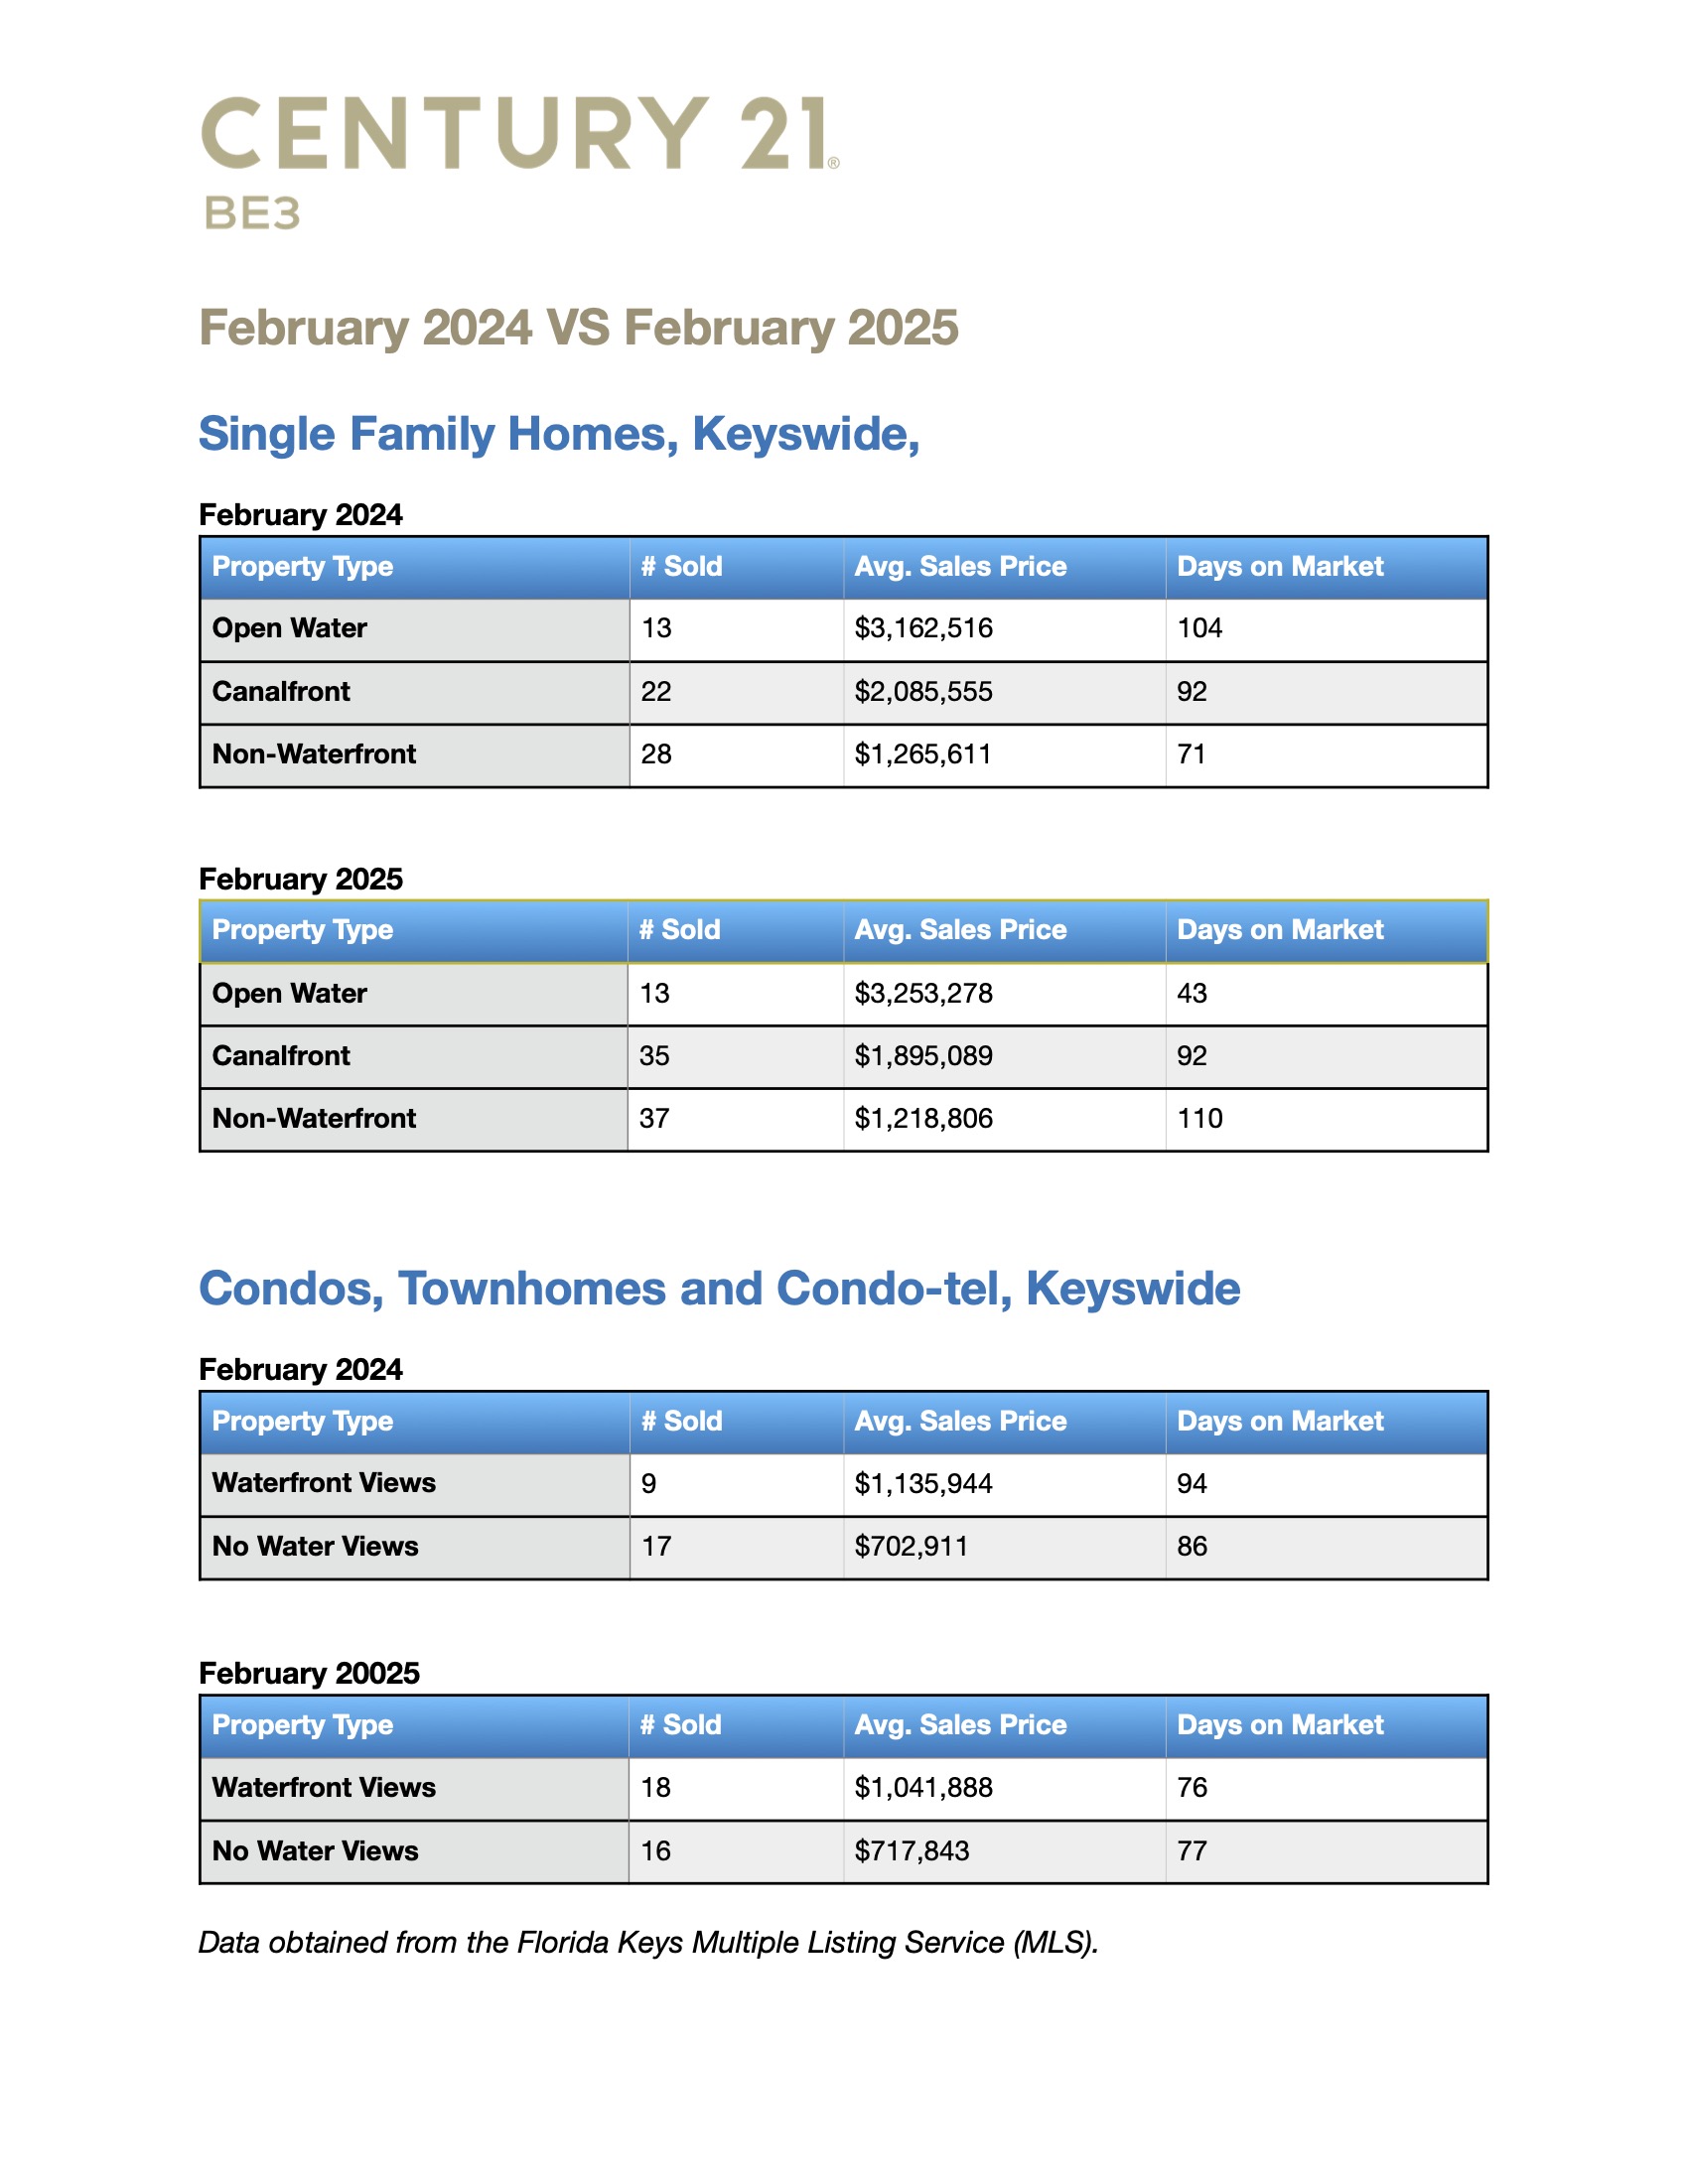
The Florida Keys real estate market has experienced notable shifts between February 2024 and February 2025. By analyzing trends in single-family homes and condos/townhomes, we can better understand how pricing, demand, and sales activity have evolved.
Single-Family Homes: A Market in Transition
Open Water Homes
- Sales Volume: 13 homes sold (unchanged from 2024)
- Average Price: ↑ 2.9% ($3,253,278 vs. $3,162,516)
- Days on Market: ↓ 58.7% (43 days vs. 104 days)
Key Takeaway: While the number of sales remained the same, prices increased slightly. More importantly, homes sold much faster, suggesting stronger buyer demand and a more competitive market.
Canalfront Homes
- Sales Volume: ↑ 59% (35 sales vs. 22)
- Average Price: ↓ 9.1% ($1,895,089 vs. $2,085,555)
- Days on Market: No Change (92 days)
Key Takeaway: On the one hand, canalfront properties saw a significant jump in sales activity, indicating increased interest from buyers. On the other hand, the drop in average sales price suggests that sellers may have adjusted expectations to attract more offers.
Non-Waterfront Homes
- Sales Volume: ↑ 32% (37 sales vs. 28)
- Average Price: ↓ 3.7% ($1,218,806 vs. $1,265,611)
- Days on Market: ↑ 54.9% (110 days vs. 71)
Key Takeaway: Although sales activity increased, homes took significantly longer to sell, and prices dipped slightly. This could indicate a more selective buyer pool or a higher inventory of non-waterfront homes competing for attention.
Condos, Townhomes, and Condo-tels: Steady but Shifting
Waterfront View Units
- Sales Volume: ↑ 100% (18 sales vs. 9)
- Average Price: ↓ 8.3% ($1,041,888 vs. $1,135,944)
- Days on Market: ↓ 19.1% (76 days vs. 94)
Key Takeaway: Waterfront condos and townhomes saw twice as many sales compared to last year. However, prices declined slightly, suggesting that while demand increased, buyers may have been more price-conscious or that more lower-priced units entered the market.
Non-Waterfront Units
- Sales Volume: ↓ 5.9% (16 sales vs. 17)
- Average Price: ↑ 2.1% ($717,843 vs. $702,911)
- Days on Market: ↓ 10.5% (77 days vs. 86)
Key Takeaway: Even though the number of sales dipped slightly, prices still increased, and properties sold faster than last year. This suggests that buyers continue to find value in non-waterfront condos, particularly as affordability remains a key factor in purchasing decisions.
Overall Market Trends
- Luxury waterfront homes remain in high demand, with faster sales and higher prices for open water properties.
- Canalfront homes attracted more buyers, though prices softened, indicating a shift in buyer expectations.
- Non-waterfront homes moved more slowly, highlighting a potential increase in supply or shifting buyer preferences.
- The condo market remained active, with sales doubling for waterfront units and stable pricing for non-waterfront options.
Looking ahead, the Florida Keys real estate market remains strong, particularly for buyers seeking waterfront properties. While some price adjustments occurred, the market continues to show resilience and steady demand as we move into 2025.


